Case Studies
Back to Optimization Solutions
Case Study: Asset Integrated Dashboard (AID) Solution
An Interactive Tool To Help Navigate Your Utility Infrastructure
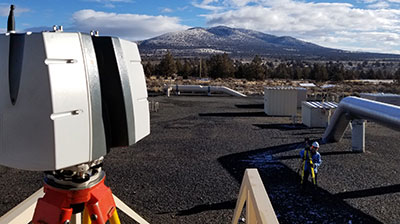
Many existing utility infrastructure systems have disconnected documentation that lacks any built-in technology. This makes managing these systems and understanding their layout a cumbersome task.
The Asset Integrated Dashboard (AID) is a visual and virtual solution to help client’s with a large campus footprint manage their utility infrastructure. The solution creates an asset inventory system by pulling together multiple sets of data into an interactive dashboard. This allows the user to visualize the system, navigate to a particular zone, and click to view video and other pertinent data.
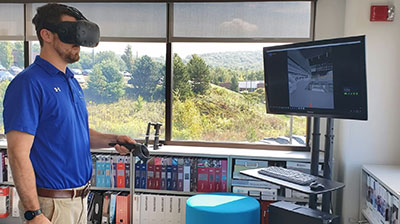
The AID allows users to remotely and easily access to important information leading to streamlined communication, improved planning, enhanced safety, and many other benefits. It is designed to be a scalable solution that can be built on over time and leveraged for various uses throughout a company.
Transforming A Static Report Into An Interactive Dashboard
Precise Visual Technologies (PVT) developed this solution as part of a project to inspect deficiencies within an industrial client’s vast sewer system. The standard deliverable for this type of project was a static report with a spreadsheet full of valuable but disconnected data that was cumbersome to navigate.
Our Innovation Team transformed the deliverable into an interactive dashboard that allowed the client to efficiently navigate to any area within their system.
Contact PVT to find out how you can efficiently document and manage your infrastructure project before you have an unexpected issue.